All objects have a certain inherent vibration. For example, each tone bar of a xylophone has a different length and therefore has a different (natural) frequency of vibration, which produces different tones. Generally, the larger or heavier the object, the lower the frequency. If a structure is shaken at the same frequency as this “natural frequency,” it will resonate, and the vibration will be extremely large, causing abnormal noise and vibration, and in the worst case, the structure will be damaged. For example, when riding in a car, the vibrations and noise become louder at a certain speed, but at lower or faster speeds the sound and vibrations may not be as loud. This is caused by vibration and resonance. Therefore, some machines require that certain natural frequencies be avoided during design. Particular attention should be paid to rotating machinery, as vibrations are likely to occur when the rotational speed and resonance frequency coincide. Natural frequency can be estimated in advance by eigenfrequency analysis.
As to a robotic arm, rapid acceleration and sudden stopping are required to make its quick movements. When its natural frequency is low, vibration may cause a problem. In this case, it is possible to predict how much the end of arms will sway by simulating a sudden stop as a vibration analysis (transient response analysis).
Eigenvalue analysis example
Natural frequencies and mode shapes of small satellites
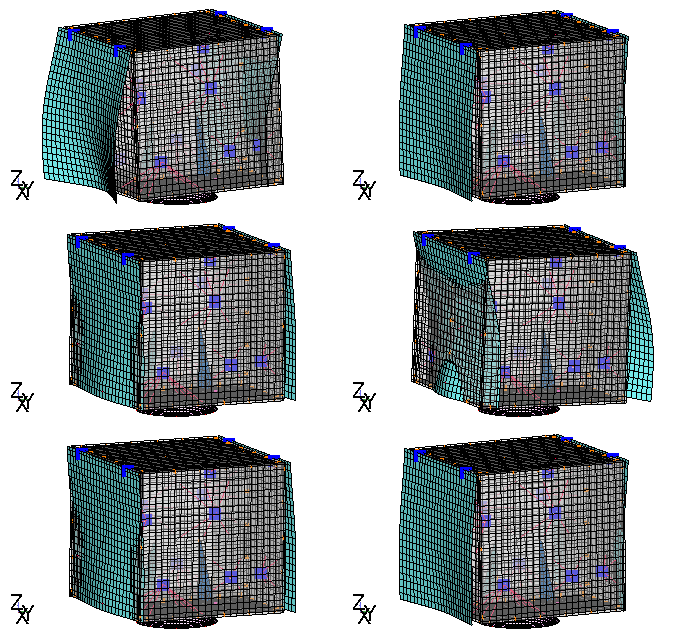
The natural frequencies and mode shapes of a structure made of composite materials and honeycomb panels are shown in the left figure. The effective mass ratio indicates in which direction and to what degree the mode oscillates, i.e., whether the mode is susceptible to excitation.
Frequency response analysis example
Response acceleration, transfer function, and intensity during sinusoidal vibration test
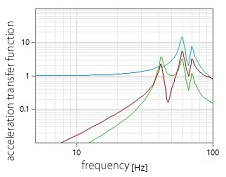
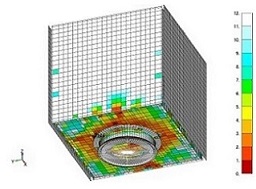
Above is a sample of prediction analysis to prevent structural failure during sinusoidal vibration testing, of finding where and how response occurs at the acceleration measurement point, and of prediction of strength of the structure. The transfer function shows that a high response occurs at natural frequencies where the effective mass ratio in the excitation direction is large. And the sample also indicates that response acceleration will be larger at sites with large oscillations in eigenmodes. Although strength evaluation of composite structures in frequency response analysis is extremely complex, the strength evaluation integrated tool developed by Technosolver allows you to visually display strength-critical areas and guide problem solving. Response acceleration and response displacement data can also be processed efficiently by using the macro function of spreadsheet software.
Random response analysis example
Response acceleration PSD/effective value during random vibration test
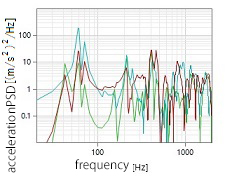
The left figure shows the acceleration generated in electronic equipment inside a structure during a random vibration test, which is used to evaluate if the allowable values are exceeded. Random response analysis analyzes the response to random vibrations caused by overlapping inputs of several frequencies and amplitudes. Inputs and results are expressed as power spectrum density (PSD) function and root mean square value (RMS). Many standards specify resistance to transportation and operating environments through random vibration testing. And analytical predictions before testing are also effective in designing structures and selecting parts.
Transient response analysis example
Response of electronic equipment racks during earthquakes
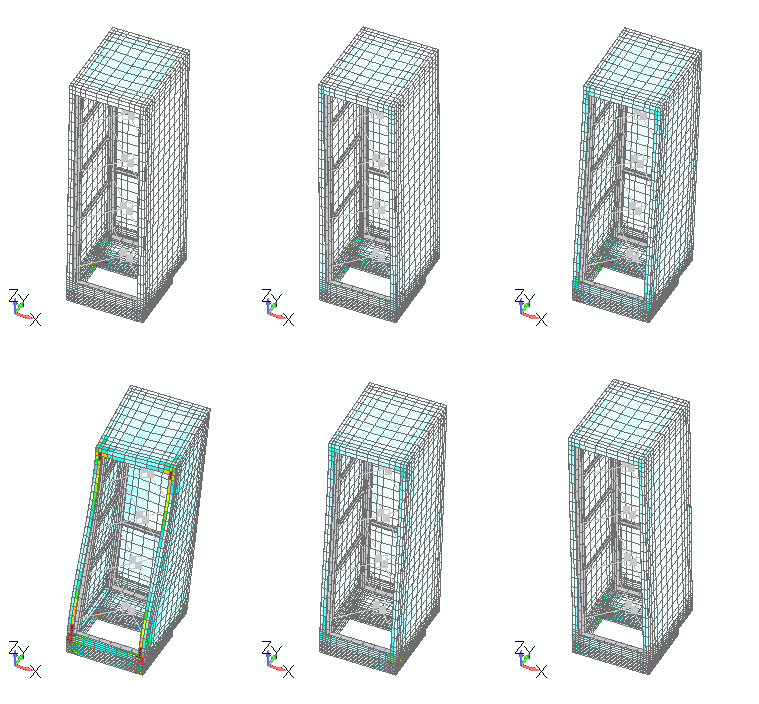
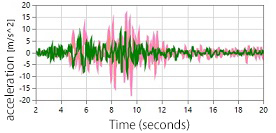
The response of electronic equipment racks during an earthquake is analyzed to evaluate whether stresses in the members do not exceed allowable values, whether displacement is sufficient to not cause collision with adjacent structures, and whether excessive acceleration not occurs in the internal equipment. Transient response analysis allows you to determine how a structure responds as loads change over time.

